Date: Wed, 19 Jan 2000 08:23:03 +0100
Hi,
My SQUID2.2.STABLE5 is running for several weeks now wihout any problem whatsoever on Linux (2.2.13) but I see some weird things in the SNMP-graphs wich are produced by MRTG
The Story :
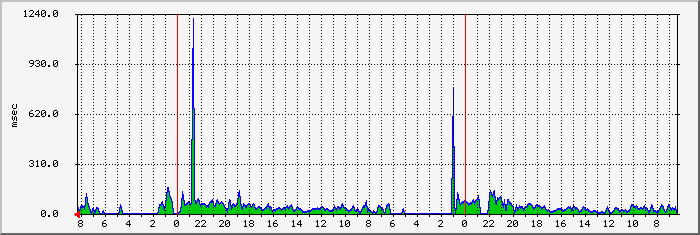
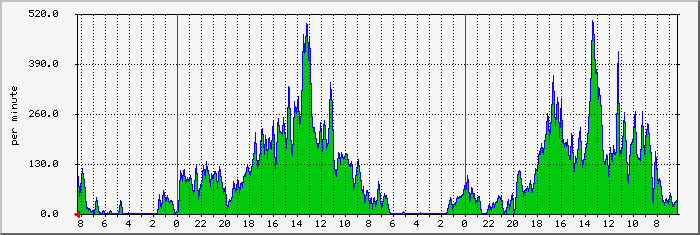
I've included graphs for HIT-SVC (HIT Average Service Time) and REQ (# REQUESTS / MINUTE)
Should I worry about "the spikes" in the HIT-SVC graphs ... this is normally rather low (between 10ms en 50ms) but "spikes" sometimes to 1500ms or more ;-)
The funny thing is that this happens during "night time" when the #requests is very,very low ...
During daytime I get peaks of about 520requests/minute and then the response times are very good (average 20ms - 50ms) for my site...
Now I probably shouldn't care, but seeing those spikes looks weird ;-)
Regards,
Jan Van Ham
BELGIUM

